Advanced Pizzeria Management Power BI Project
This Power BI report is a comprehensive visualization of the pizza business's operations, leveraging data from the SQL-based project to provide dynamic, actionable insights. The report is structured into three main dashboards, each addressing a specific area of the business: Order Activity, Inventory Management, Staff
Project Description
This Power BI report transforms raw data into meaningful insights, empowering data-driven decisions to enhance operational efficiency and customer satisfaction.
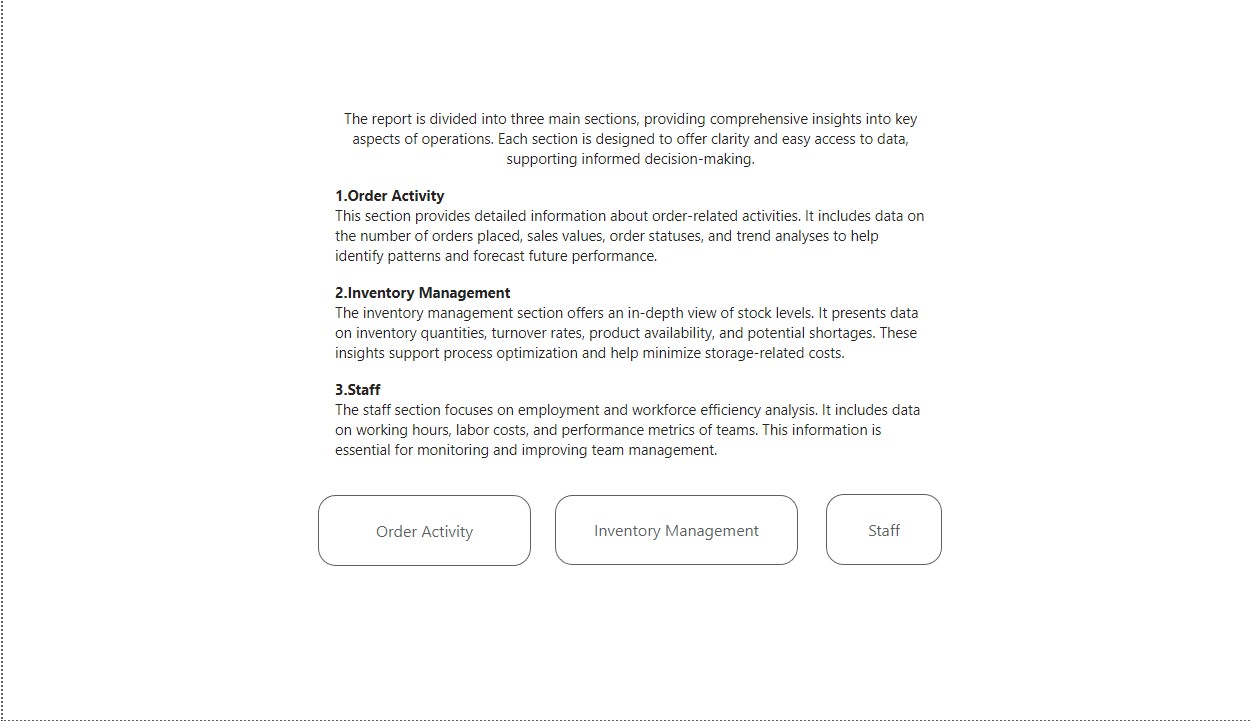
1. Landing Page
The report begins with a Landing Page, serving as a central navigation hub. From here, users can access any section of the report with ease, ensuring smooth exploration of the data. The landing page includes interactive buttons and links that guide users to:
- Order Activity
- Inventory Management
- Staff
This intuitive starting point enhances user experience, making the report easy to navigate and highly accessible.
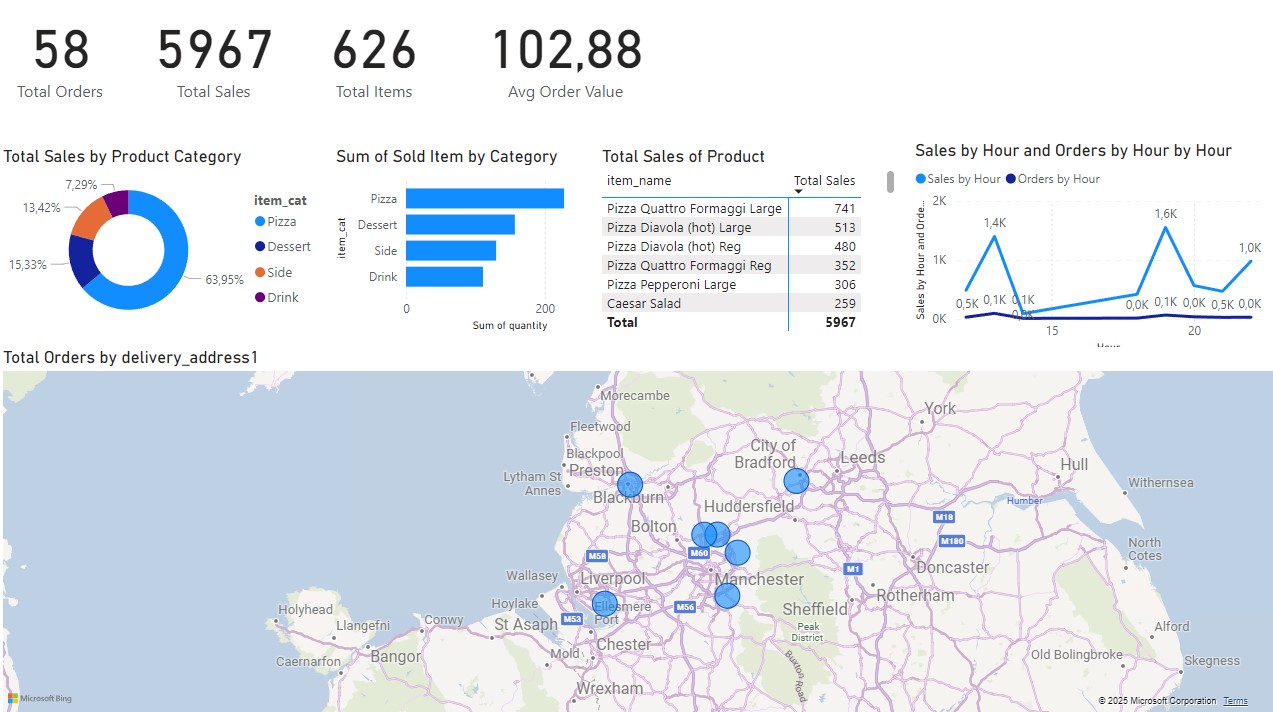
2. Order Activity
The second dashboard focuses on inventory management, showcasing:
- Ingredient usage: Total quantity of each ingredient used.
- Stock levels: Remaining inventory percentage for each ingredient.
- Reorder alerts: Highlights ingredients nearing depletion, ensuring timely restocking.
This dashboard enables effective inventory monitoring, helping to minimize waste and avoid shortages during high-demand periods.
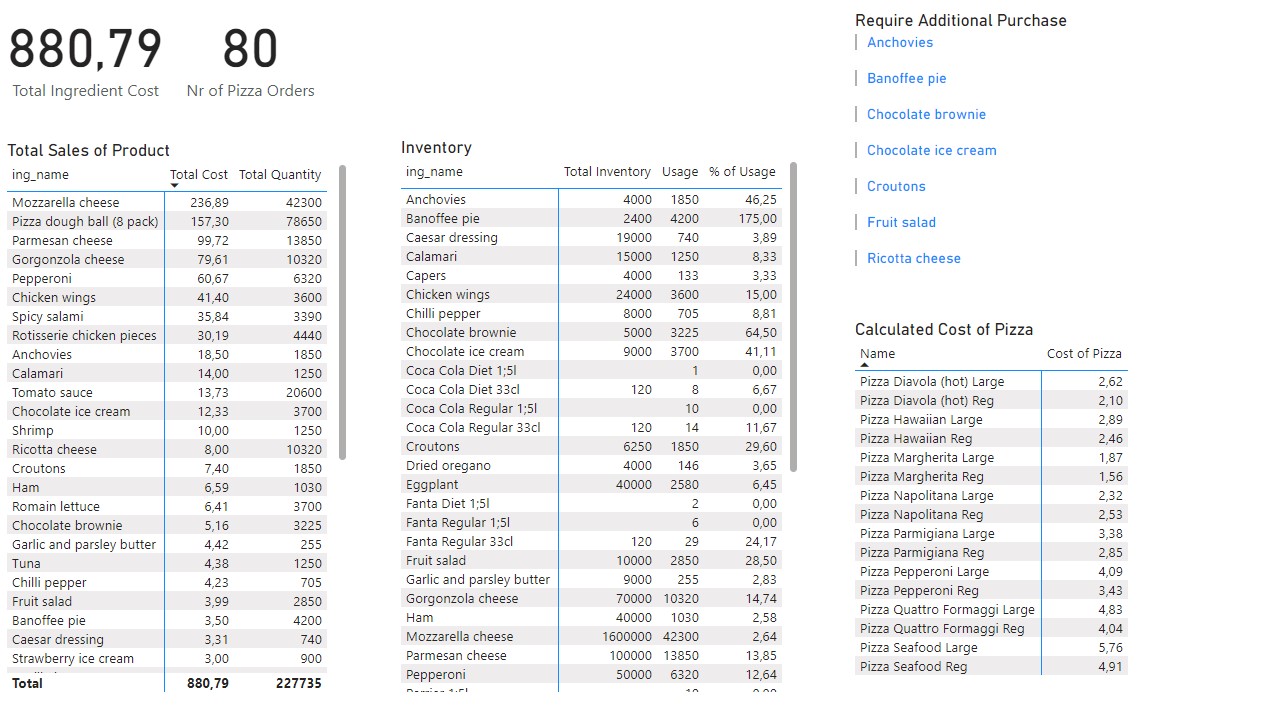
3. Inventory Management
The second dashboard focuses on inventory management, showcasing:
- Ingredient usage: Total quantity of each ingredient used.
- Stock levels: Remaining inventory percentage for each ingredient.
- Reorder alerts: Highlights ingredients nearing depletion, ensuring timely restocking.
This dashboard enables effective inventory monitoring, helping to minimize waste and avoid shortages during high-demand periods.
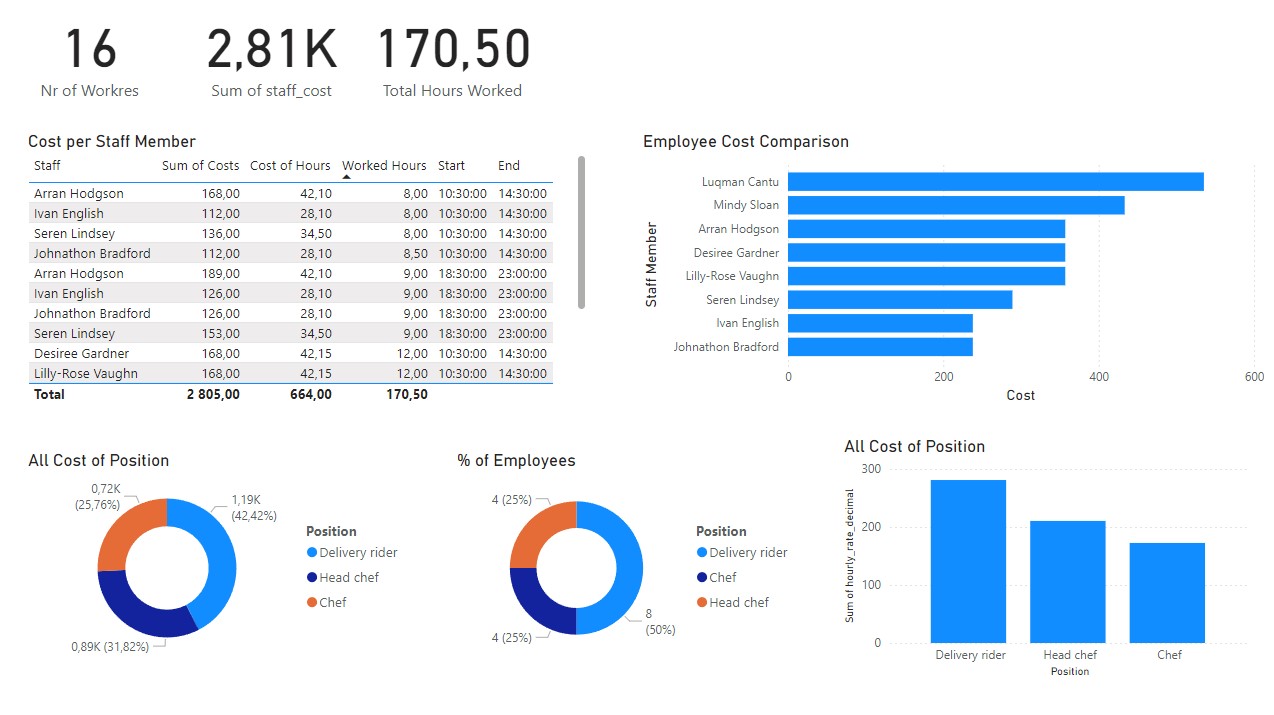
4. Staff
The final dashboard provides insights into employee operations, including:
- Total hours worked by each staff member, calculated from shift logs.
- Labor costs, based on hourly wages and total hours worked.
- A breakdown of time spent on different tasks, helping optimize workforce allocation.
This section assists in managing labor expenses and improving workforce efficiency.