COVID-19 Analysis Using R Project
This project analyzes the COVID-19 dataset using R, focusing on key aspects such as death rates, demographic factors, and statistical correlations. The dataset contains information on various COVID-19 cases, including demographics, symptoms, and outcomes. The goal of this project is to provide insights into the factors influencing COVID-19 outcomes using data exploration, statistical testing, and visualization.
Project Description
# 🦠 COVID-19 Analysis Using R
## 📊 Project Overview
This project analyzes the COVID-19 dataset using R, focusing on key aspects such as death rates, demographic factors, and statistical correlations. The dataset contains information on various COVID-19 cases, including demographics, symptoms, and outcomes. The goal of this project is to provide insights into the factors influencing COVID-19 outcomes using data exploration, statistical testing, and visualization.
### Key Objectives:
- **Calculate the overall death rate** and its percentage.
- **Analyze the effect of age on survival** and test statistical significance.
- **Evaluate gender's influence on COVID-19 outcomes** using hypothesis testing.
- **Visualize data distributions and trends**, such as age distribution and deaths by country.
- **Build logistic regression models** to predict death probabilities based on key variables.
---
## 📅 Data Overview
The dataset consists of:
- **Demographics**: Age, gender, country.
- **COVID-19 specifics**: Symptom onset, hospital visits, outcomes.
- **Binary outcome**: Death (1) or Survival (0).
---
## 🛠 Tools and Techniques
### Data Cleaning:
- Added a `death_dummy` variable to indicate death outcomes.
- Handled missing values using `na.rm = TRUE` in calculations.
### Statistical Analysis:
- Calculated the mean age for survivors and non-survivors.
- Conducted t-tests to assess the significance of differences in age and gender's impact on death rates.
### Data Visualization:
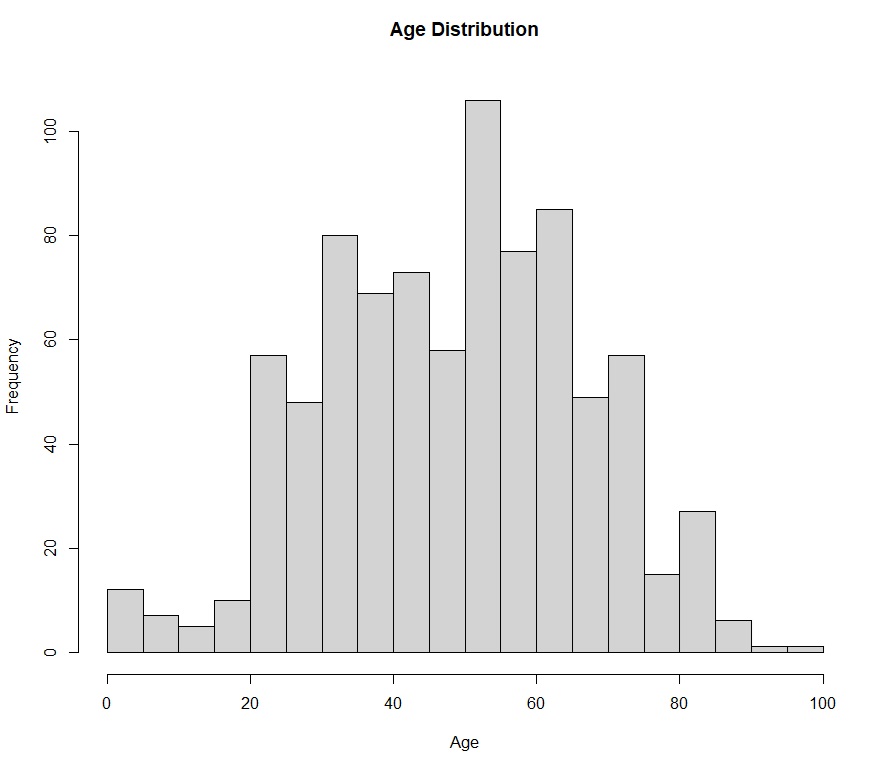
- **Histograms**: Displayed the age distribution of all cases.
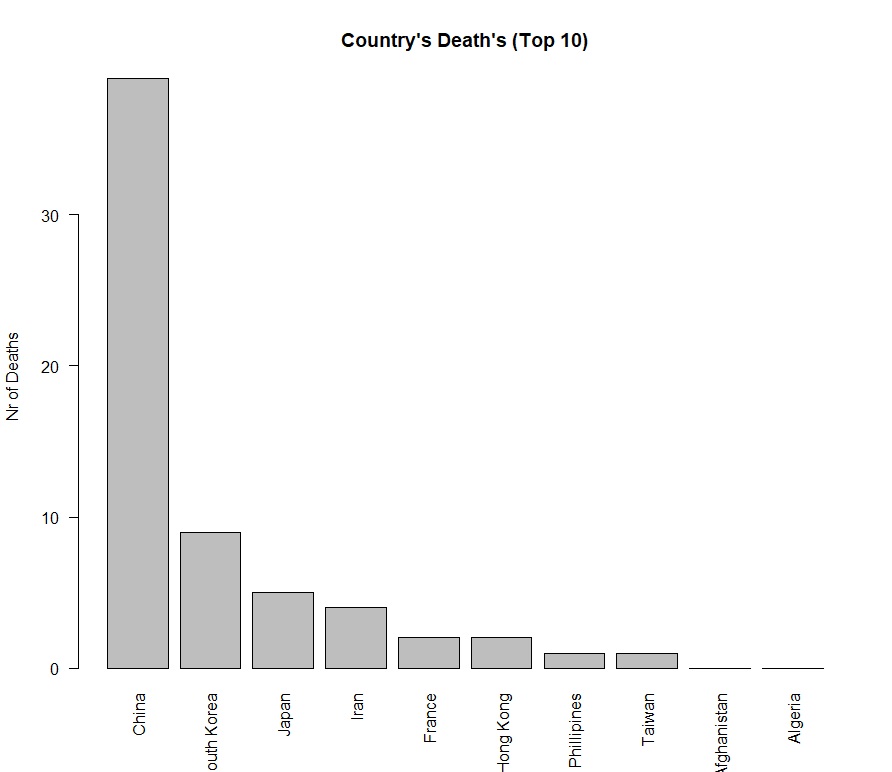
- **Bar Charts**: Showed top 10 countries by number of deaths.
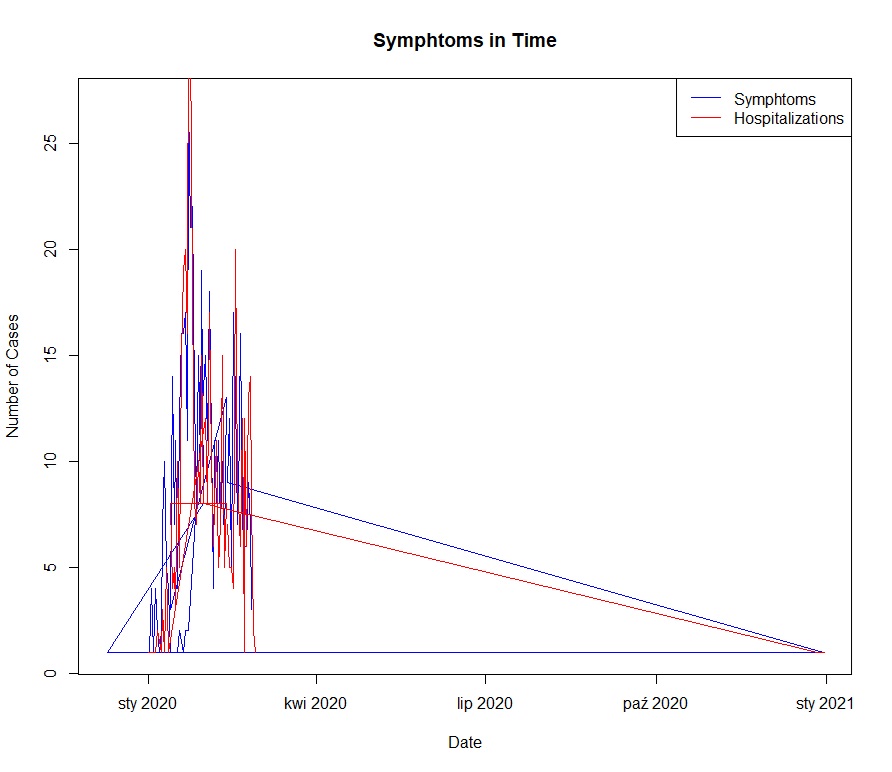
- **Line Charts**: Illustrated the trends of symptom onset and hospital visits over time.
### Modeling:
- Logistic regression models were built to assess how variables like age, gender, and location impact death probability.
---
## 📈 Key Insights
### Death Rate:
- **Overall death rate**: Approximately **5.8%** of cases resulted in death.
### Age:
- The mean age of those who died is significantly higher (**68.5 years**) than those who survived (**48 years**).
- The difference is statistically significant with a p-value < 0.05.
### Gender:
- Males have a higher death rate (**8.4%**) compared to females (**3.7%**).
- This difference is statistically significant with a p-value < 0.01.
### Geographic Insights:
- Top 10 countries by death count are highlighted, with the highest deaths recorded in specific regions.
### Temporal Trends:
- Symptom onset and hospital visit trends indicate specific peak periods for COVID-19 cases.
---
## 🔍 Statistical Tests and Modeling
### Age:
- **T-test** confirms a significant difference in the mean age of deceased versus surviving individuals.
### Gender:
- **T-test** supports the conclusion that gender has a significant effect on death rates, favoring females.
### Logistic Regression:
- Logistic models revealed that age, gender, visiting Wuhan, and being from Wuhan are significant predictors of death probability.
---
## 🌟 Why This Project Matters
Understanding the factors influencing COVID-19 outcomes provides valuable insights for policymakers, healthcare providers, and the general public. This project demonstrates how R can be used to transform raw data into actionable insights, enabling data-driven decisions during a global pandemic.
---
## 🛠 Tools Used
- **Data Exploration**: `Hmisc` package and base R functions.
- **Visualization**: `hist()`, `barplot()`, `plot()`, and custom line charts.
- **Statistical Analysis**: T-tests and logistic regression (`glm()`).
---
### 📥 How to Use This Project
1. Clone the repository: `git clone <repository-link>`
2. Open the R script: `COVID19_analysis.R`
3. Install required packages: `install.packages("Hmisc")`
4. Run the script and explore insights.
---
## 🚀 Future Work
- Explore additional variables such as comorbidities and treatment types.
- Perform cluster analysis to identify patterns in COVID-19 cases.
- Build advanced machine learning models for outcome prediction.
**Stay safe and informed!**