R Project Chickens
Chicken Feed Analysis Using R
This project analyzes the chickwts dataset in R, which contains information on chicken weights and the type of feed they were given. The goal was to explore and visualize the dataset to uncover patterns and relationships between feed type and chicken growth. The project demonstrates R's capabilities in data exploration, visualization, and statistical analysis.
Project Description
Key Objectives:
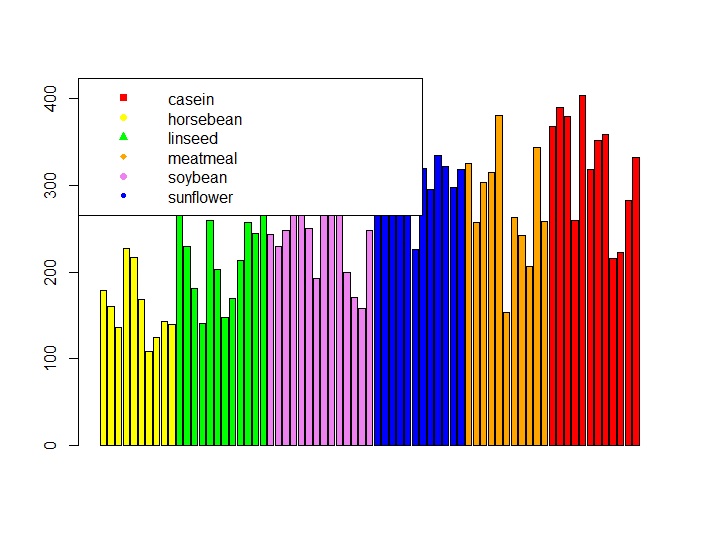
- Visualize the distribution of chicken weights using scatter plots, bar charts, and histograms.
- Identify the most popular feed types and their impact on chicken weights.
- Compare average weights across feed types using boxplots and summary statistics.
- Provide actionable insights on which feed types yield the best growth results.
📅 Data Overview
The dataset consists of:
weight: Chicken weights in grams.feed: Types of feed given to chickens (e.g., casein, sunflower, horsebean).
🛠 Tools and Techniques
This project utilized various tools and techniques in R to explore and visualize the dataset effectively:
- Data Exploration: Functions like
data()andnrow()were used to inspect the dataset, while basic plots (plot()) were employed to visualize initial patterns in chicken weights. - Custom Visualizations: Enhanced scatter plots with custom colors and shapes using:
my_colorsandmy_shapesvectors for feed-based differentiation.- Added legends to improve interpretability with
legend().
- Bar Charts: Used
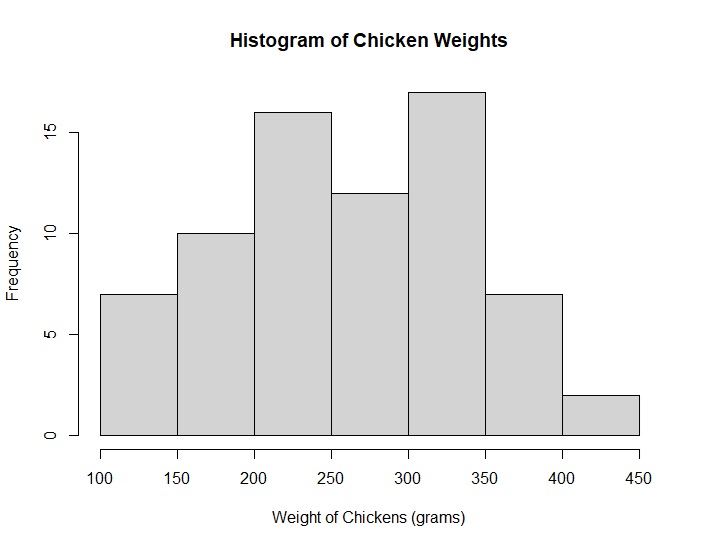
barplot()to display the distribution of weights by feed type, incorporating custom colors for better visualization. - Histograms: Visualized the distribution of chicken weights with
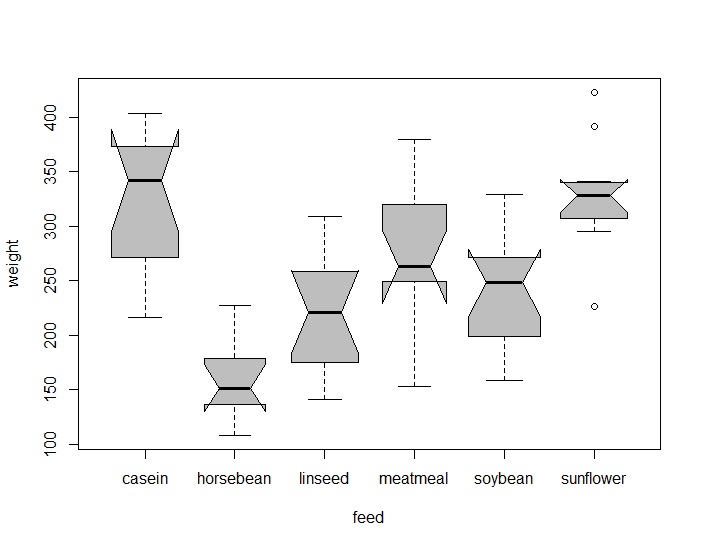
hist(), highlighting frequency trends across weight ranges. - Boxplots: Compared weight distributions across feed types using
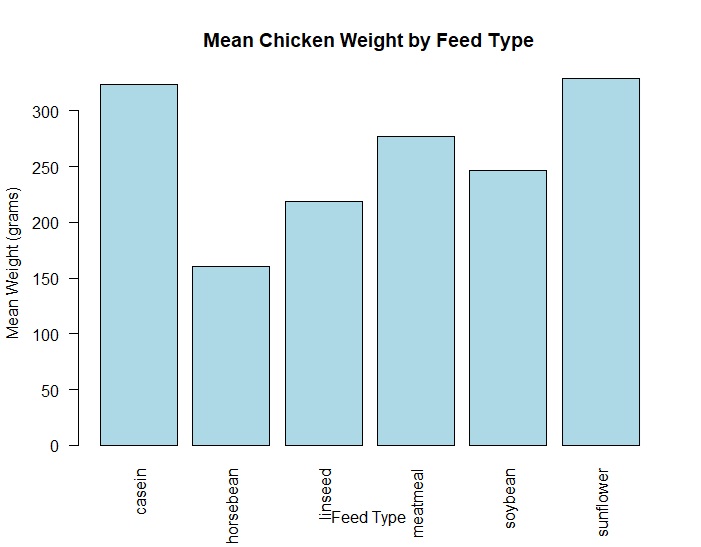
boxplot()with features likenotch = TRUEandvarwidth = TRUEfor better visual insights into median and variability. - Statistical Analysis: Calculated mean weights for each feed type using
tapply()and visualized them with a grouped bar chart (barplot()). - Data Cleaning: Ensured consistent analysis by:
- Mapping colors and shapes to feed types.
- Sorting chickens by weight for better grouping and analysis.
- Using
na.rm = TRUEin calculations to handle any potential missing values.
📈 Key Insights
Weight Distribution:
- Most chickens weighed between 300–350 grams.
- Very few chickens exceeded 400 grams.
Feed Type Popularity:
- Casein and sunflower were the most commonly used feed types.
Feed Efficiency:
- Chickens fed with casein showed the highest average weight, while those fed with linseed had the lowest.
Variability:
- Boxplots revealed significant variability in weight for certain feed types, indicating inconsistent results.
🧹 Data Cleaning Story
Color and Shape Mapping:
- Assigned specific colors and shapes to feed types for better visualization clarity.
Sorting and Grouping:
- Ordered chickens by weight to ensure consistent insights.
Handling Missing Data:
- Although the dataset had no missing values, precautions were included with
na.rm = TRUE.
🌟 Why This Project Matters
Understanding how feed types impact chicken growth allows for data-driven decisions in optimizing poultry farming. This project demonstrates how R can transform raw data into actionable insights through statistical analysis and visualization.