Power BI Project
Advanced Power BI Project
The employee report is divided into three main dashboards: Overview, Training, and Recruitment. Using Power BI, I leveraged tools such as DAX for advanced calculations, Power Query for data transformation, and interactive visualization techniques to create dynamic and user-friendly dashboards. These tools provided in-depth insights into workforce structure, training effectiveness, and recruitment metrics, enabling data-driven decision-making for management.
Project Description
The employee report comprises three core dashboards: Overview, Training, and Recruitment. Each dashboard delivers critical insights into workforce composition, training initiatives, and recruitment activities, serving as a strategic tool to inform and optimize management decision-making processes.
1. LANDING PAGE
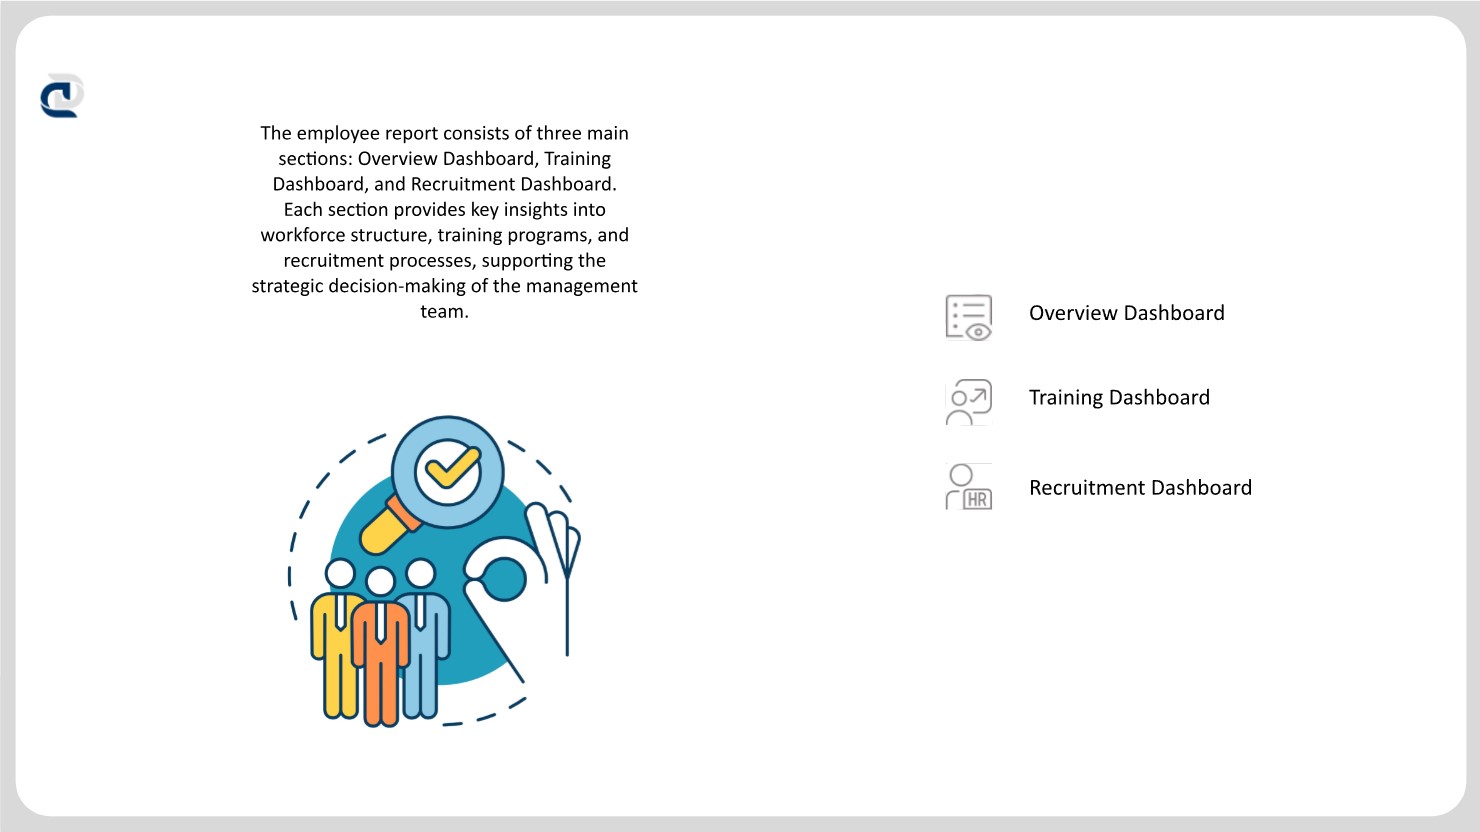
The landing page is the first screen of the report, providing an introduction to the report's scope and objectives. It includes a brief description of the content covered within the report and offers three navigation buttons that direct the user to the subsequent sections: Overview Dashboard, Training Dashboard, and Recruitment Dashboard.
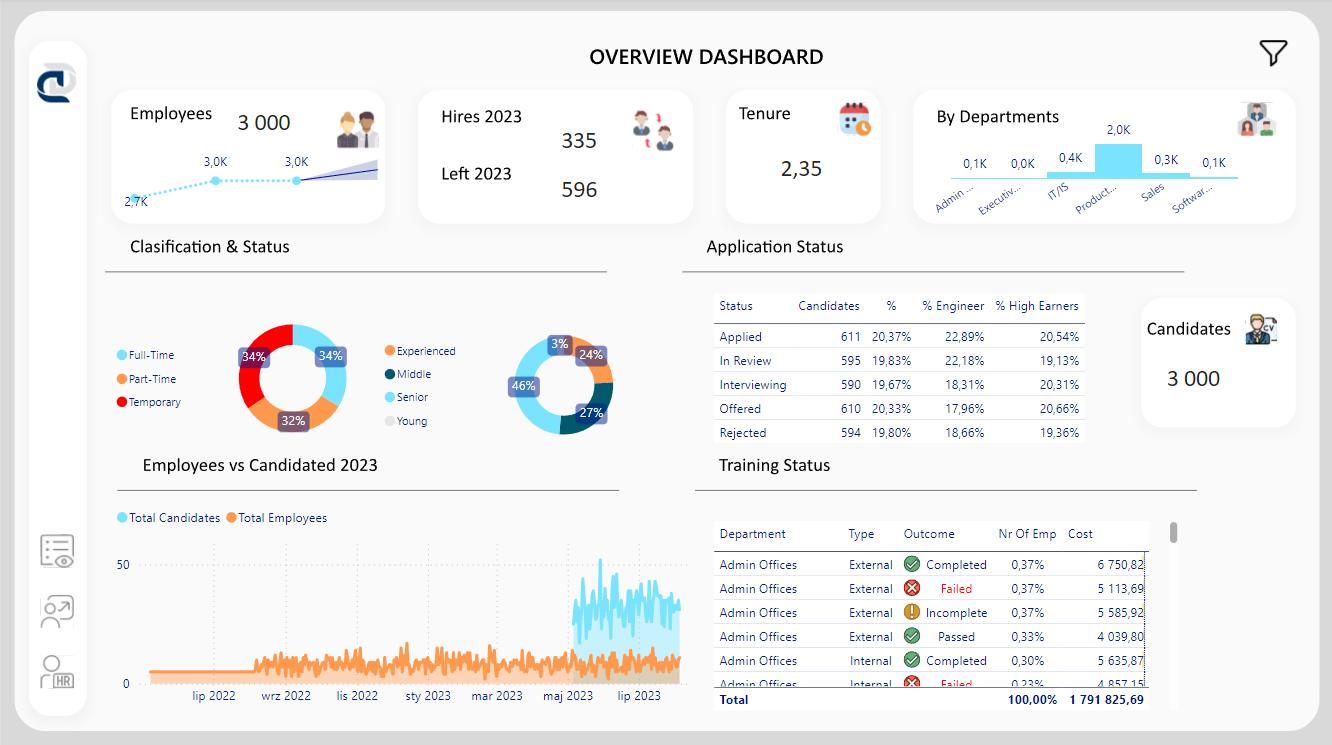
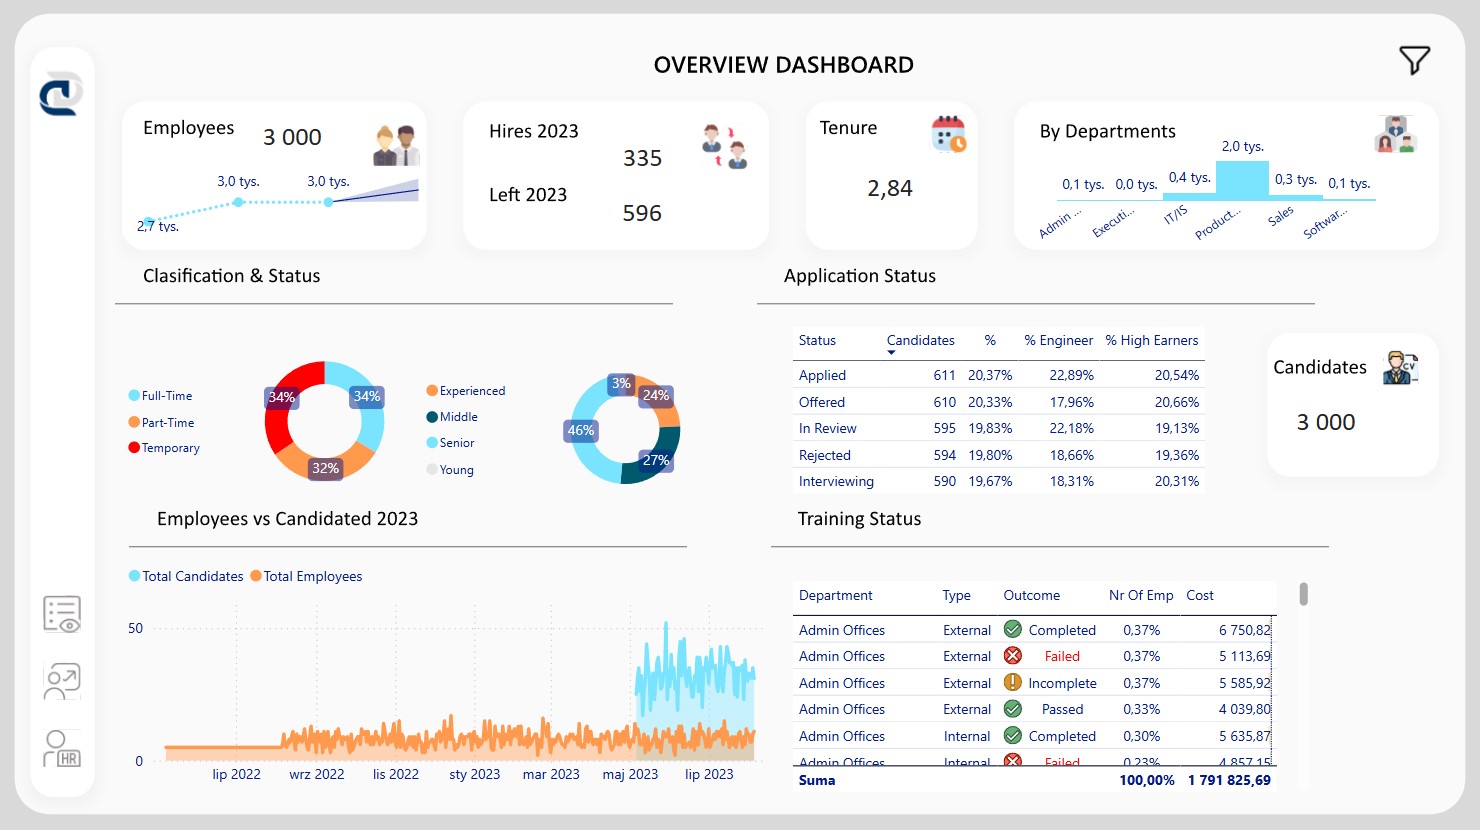
2. OVERVIEW
The Overview Dashboard visualizes the total number of employees, showing changes over time, including those hired in 2023 and those who left during the same year. It also provides detailed numerical data on the number of employees in each department. The report further breaks down job classifications and employment statuses. It includes the status of applications for open positions and provides a comparison between employees and job candidates in 2023. The section concludes with a training status overview by department.
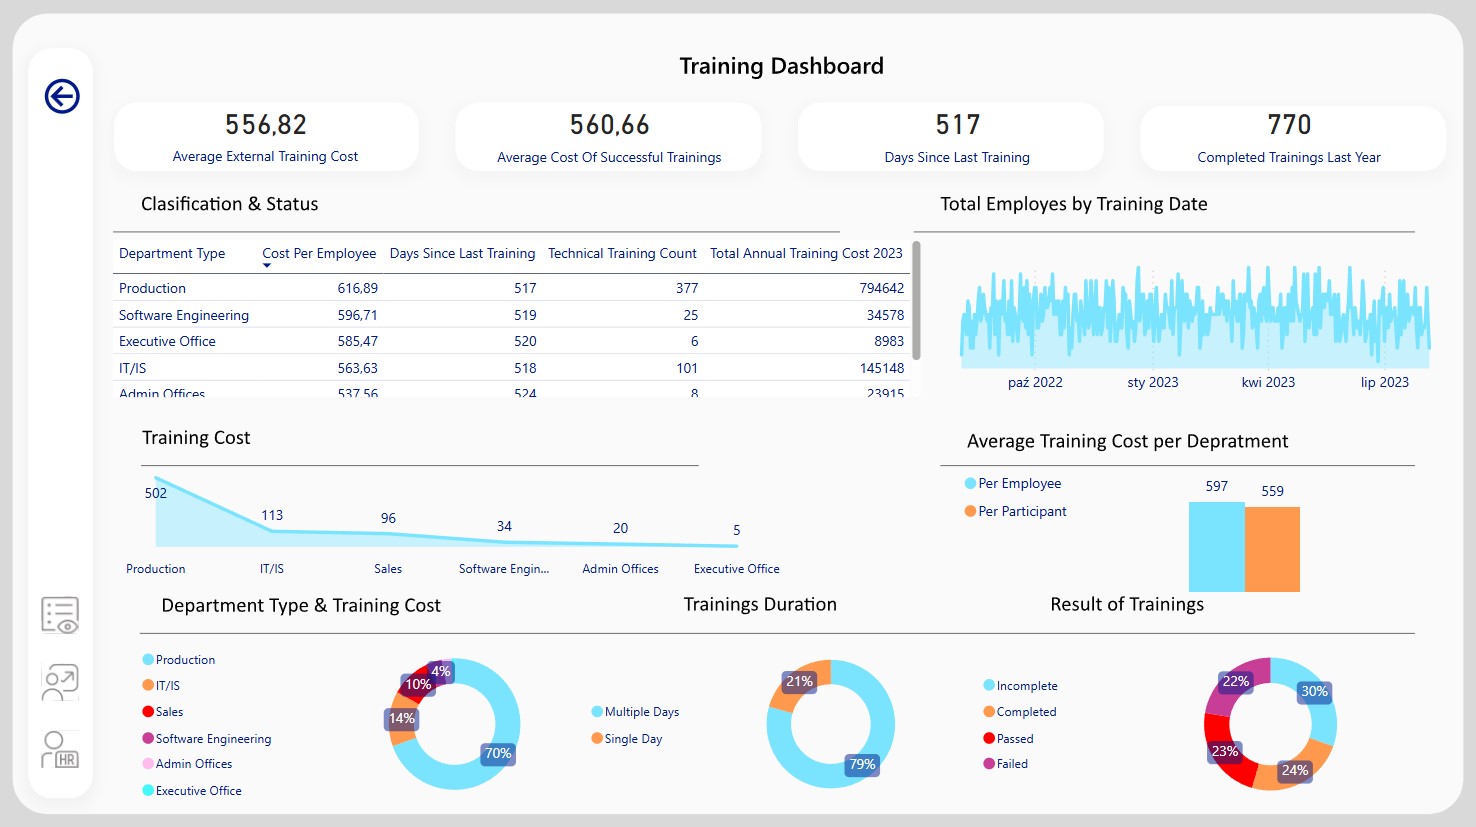
3. TRAINING
The Training Dashboard focuses on employee training costs and the number of training sessions held throughout the year. It includes classifications and status indicators related to employee training. It also presents the total number of employees categorized by training dates and provides insights into the average training cost per department. Additional data points cover the types of departments and their respective training expenses, training durations, and the outcomes of completed training sessions.
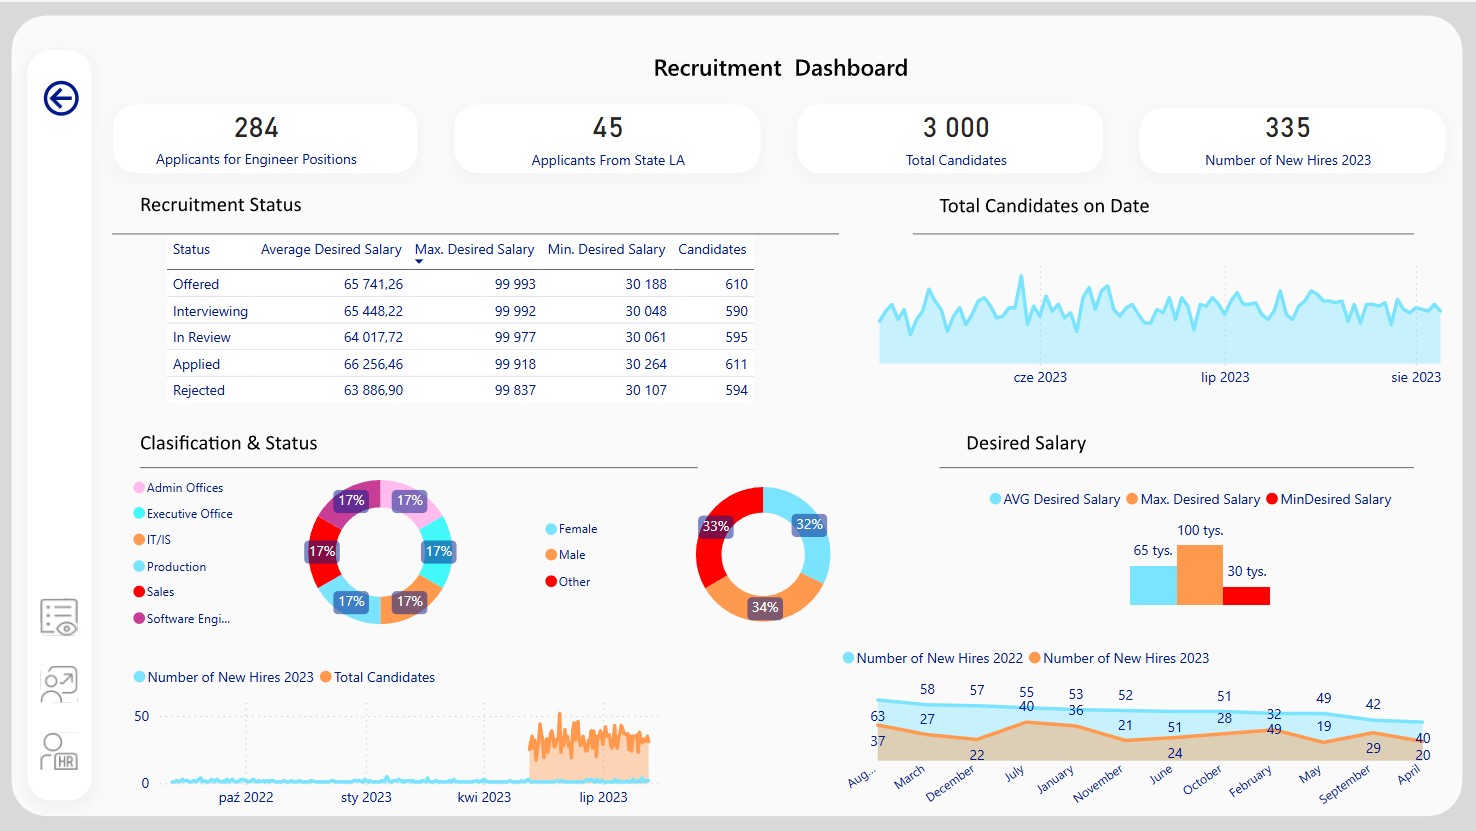
4. RECRUITMENT
The Recruitment Data section showcases applicant details, including the total number of candidates and new hires in 2023. It also visualizes the recruitment status, the total number of candidates on a specific date, and the classification and status of candidates. The section further includes a breakdown of the desired salary range for applicants, providing a detailed view of recruitment trends and priorities.
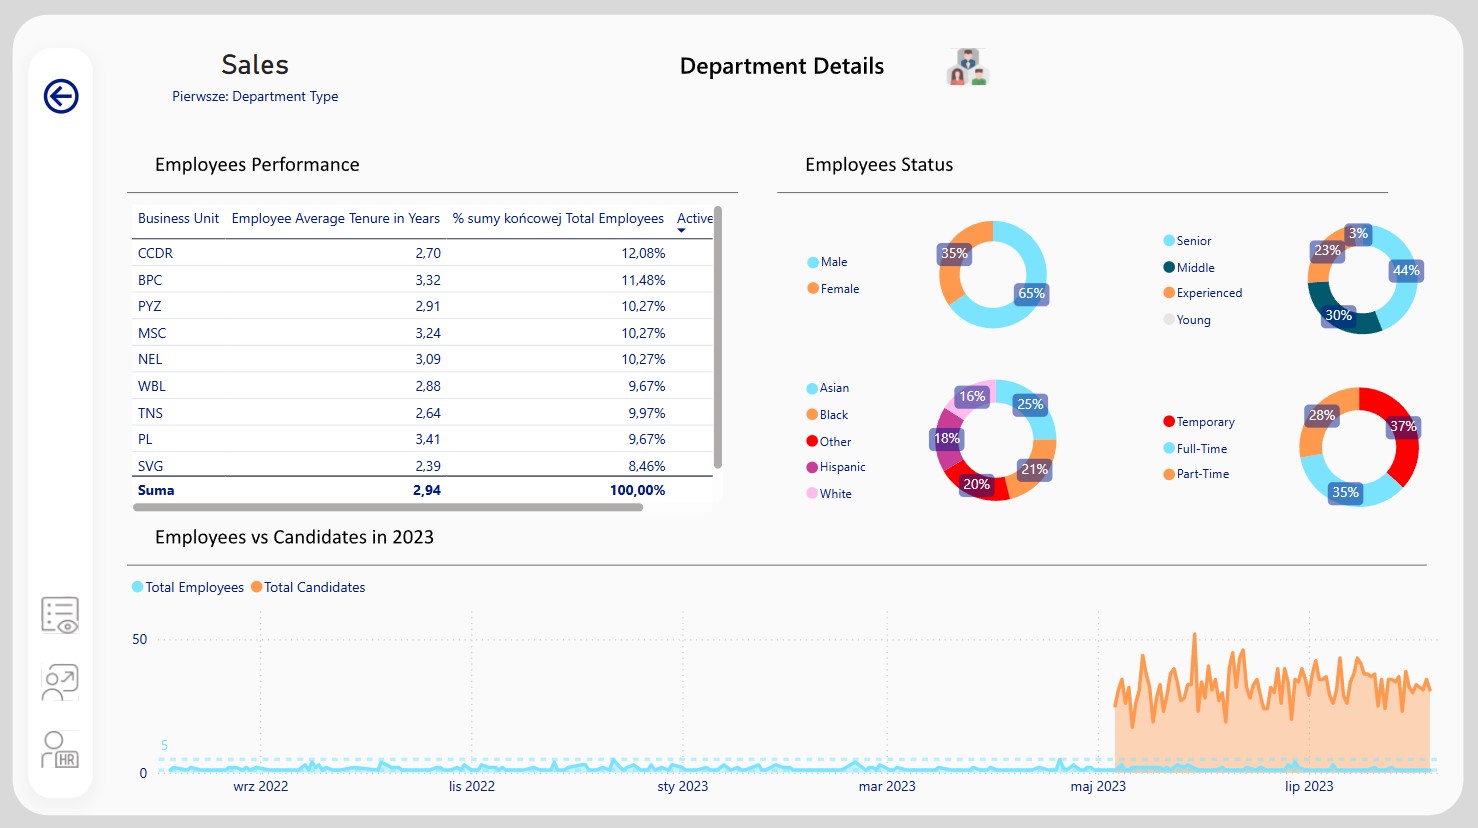
5. DEPARTMENT DETAILS
The Department Details section presents an analysis of employee performance and status, including demographic factors such as gender, skin color, work experience, and employment status. It compares the number of employees to candidates within each department in 2023, offering insights into workforce composition, diversity, and recruitment outcomes within specific teams.