L O A D I N G

Advanced Data Analysis in Python

Python Data Analysis Project: Insights into Product Returns, Customer Ratings, Sales Trends, and Shipping Costs

Project Description

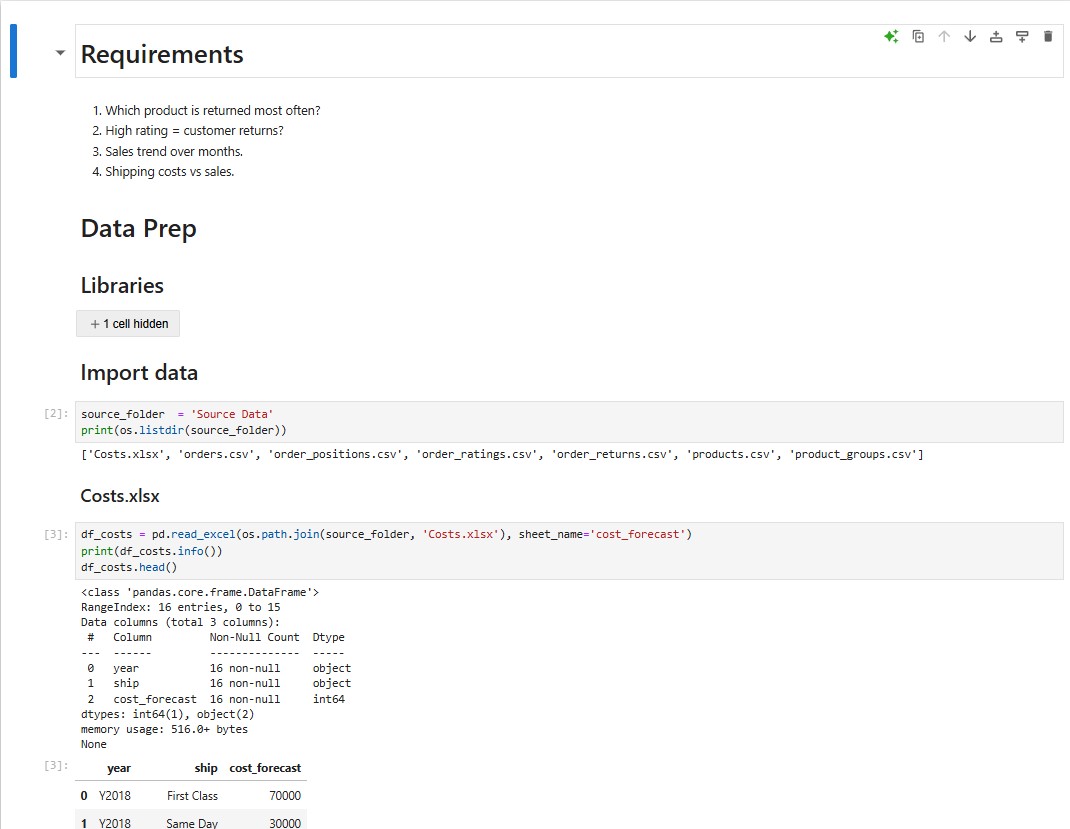
This project focuses on using Python to derive actionable insights from business data by addressing key analytical questions:

1. Which Product is Returned Most Often?

  • By aggregating and analyzing return data, the project identifies products with the highest return rates.
  • It uses Python libraries such as Pandas for data manipulation and Seaborn/Matplotlib for visualizing return quantities across categories.

2. Do High Ratings Correlate with Customer Returns?

  • The project examines the relationship between customer ratings and product return rates.
  • Aggregated data reveals that high ratings generally indicate fewer returns, while no ratings might correlate with higher return rates.
  • Insights are visualized through scatter plots and heatmaps.

3. What is the Sales Trend Over Months?

  • Sales performance is analyzed over time by transforming date fields with the to_datetime function and grouping data by months.
  • Monthly sales trends are visualized, highlighting seasonal patterns and identifying periods of high performance.

4. How Do Shipping Costs Compare to Sales?

  • The analysis combines sales and shipping cost data to calculate the relationship between these metrics.
  • Python libraries are used to create comparative visualizations showing trends and determining if shipping costs impact profitability.

Key Tools and Methods:

  • Data manipulation with Pandas and NumPy.
  • Visualizations using Matplotlib and Seaborn.
  • Statistical analysis to uncover trends and relationships in the dataset.